![]()
tracesage
See what your LangChain & LangGraph agents actually did. Local-first observability — drop in one line, watch every run live in your browser.
Try it in 30 seconds
pip install "tracesage[langchain]"
tracesage demo        # seeds a sample run and opens the live UI immediately
No API key. No config. No code. tracesage demo opens a real trace so you can
click around the graph right away. Then add one line to your own agent:
result = await graph.ainvoke(
    {"input": payload},
    config={"callbacks": [tracer.handler]},   # ← the only line you add
)
Get started → Browse examples →
Why tracesage
LangChain agents emit a rich callback stream — chain start/end, tool start/end, LLM start/end, retrieval, errors. tracesage captures all of it without changing your workflow logic, persists it locally (SQLite + gzipped blobs), and renders it in an interactive graph + timeline UI in real time.
- Zero infrastructure. No Docker. No Postgres. No external services.
pip install. The UI is fully self-contained (assets vendored, no CDN) and works offline. - Minimal-change integration. Add one callback to your existing
ainvoke— no rewrites. - Crash-safe by design. The handler never raises and the tracer never crashes your pipeline.
- Interactive graph view. Custom SVG graph (no framework), auto-laid-out. Hover, click, replay any run.
- MCP-aware. Tools loaded from MCP servers are attributed by source — see which tools came from which server vs. which are hardcoded. See MCP support.
- OpenTelemetry export. Optionally ship every trace as OTel spans to a collector / Tempo / Jaeger / Datadog / Honeycomb — the bridge to your production stack. See Configuration → OpenTelemetry export.
- Pluggable storage. SQLite today; Postgres / remote-collector / object-store backends planned.
- MIT licensed. Free forever.
Where to go next
-
Install, run an example, open the UI. Five minutes.
-
What
agent,tool,llm,retriever,chain, andmcpmean — read this first if you want to interpret a topology. -
Every
TRACESAGE_*env var explained. -
Auth, sampling, retention, the safety rails, and the OTel bridge to your stack.
-
30 before/after apps across popular use cases. Pick the closest match to your architecture and copy the integration.
-
tracesage serve/export/stats/runs/gc. -
Adding framework adapters and storage backends.
What you'll see
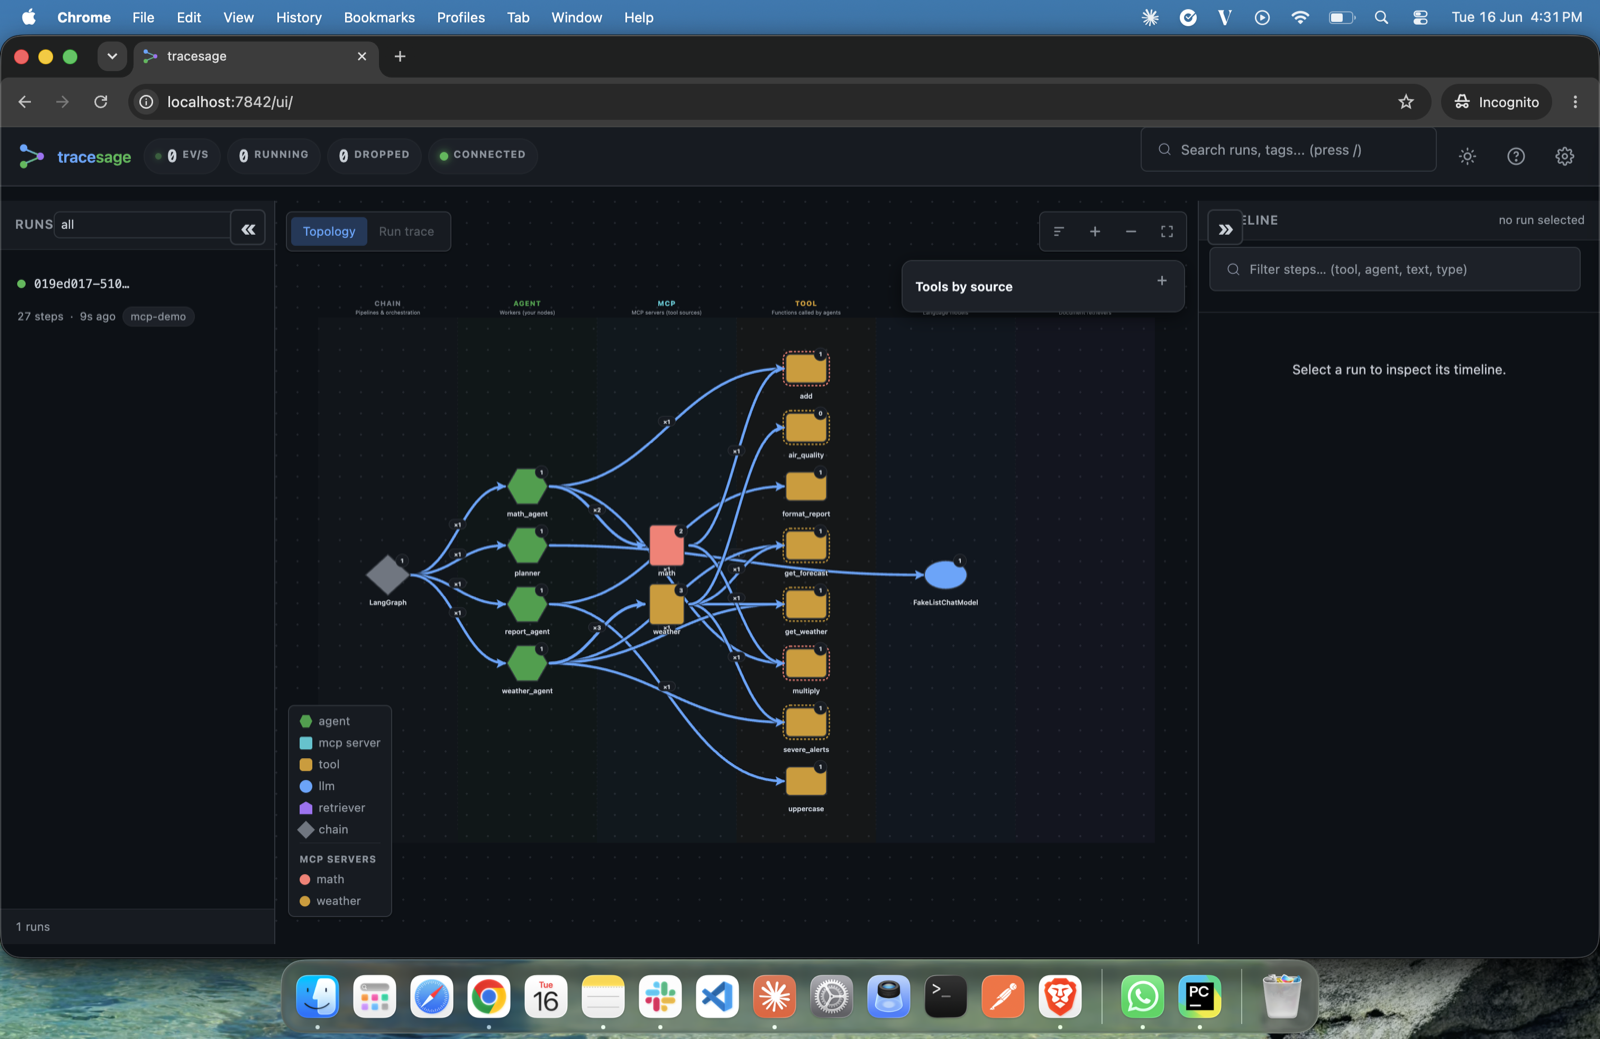 |
 |
| Live topology — agents, MCP servers, tools and LLMs, colour-coded by kind. | Run list — every run at a glance. Green = completed, red = failed. |
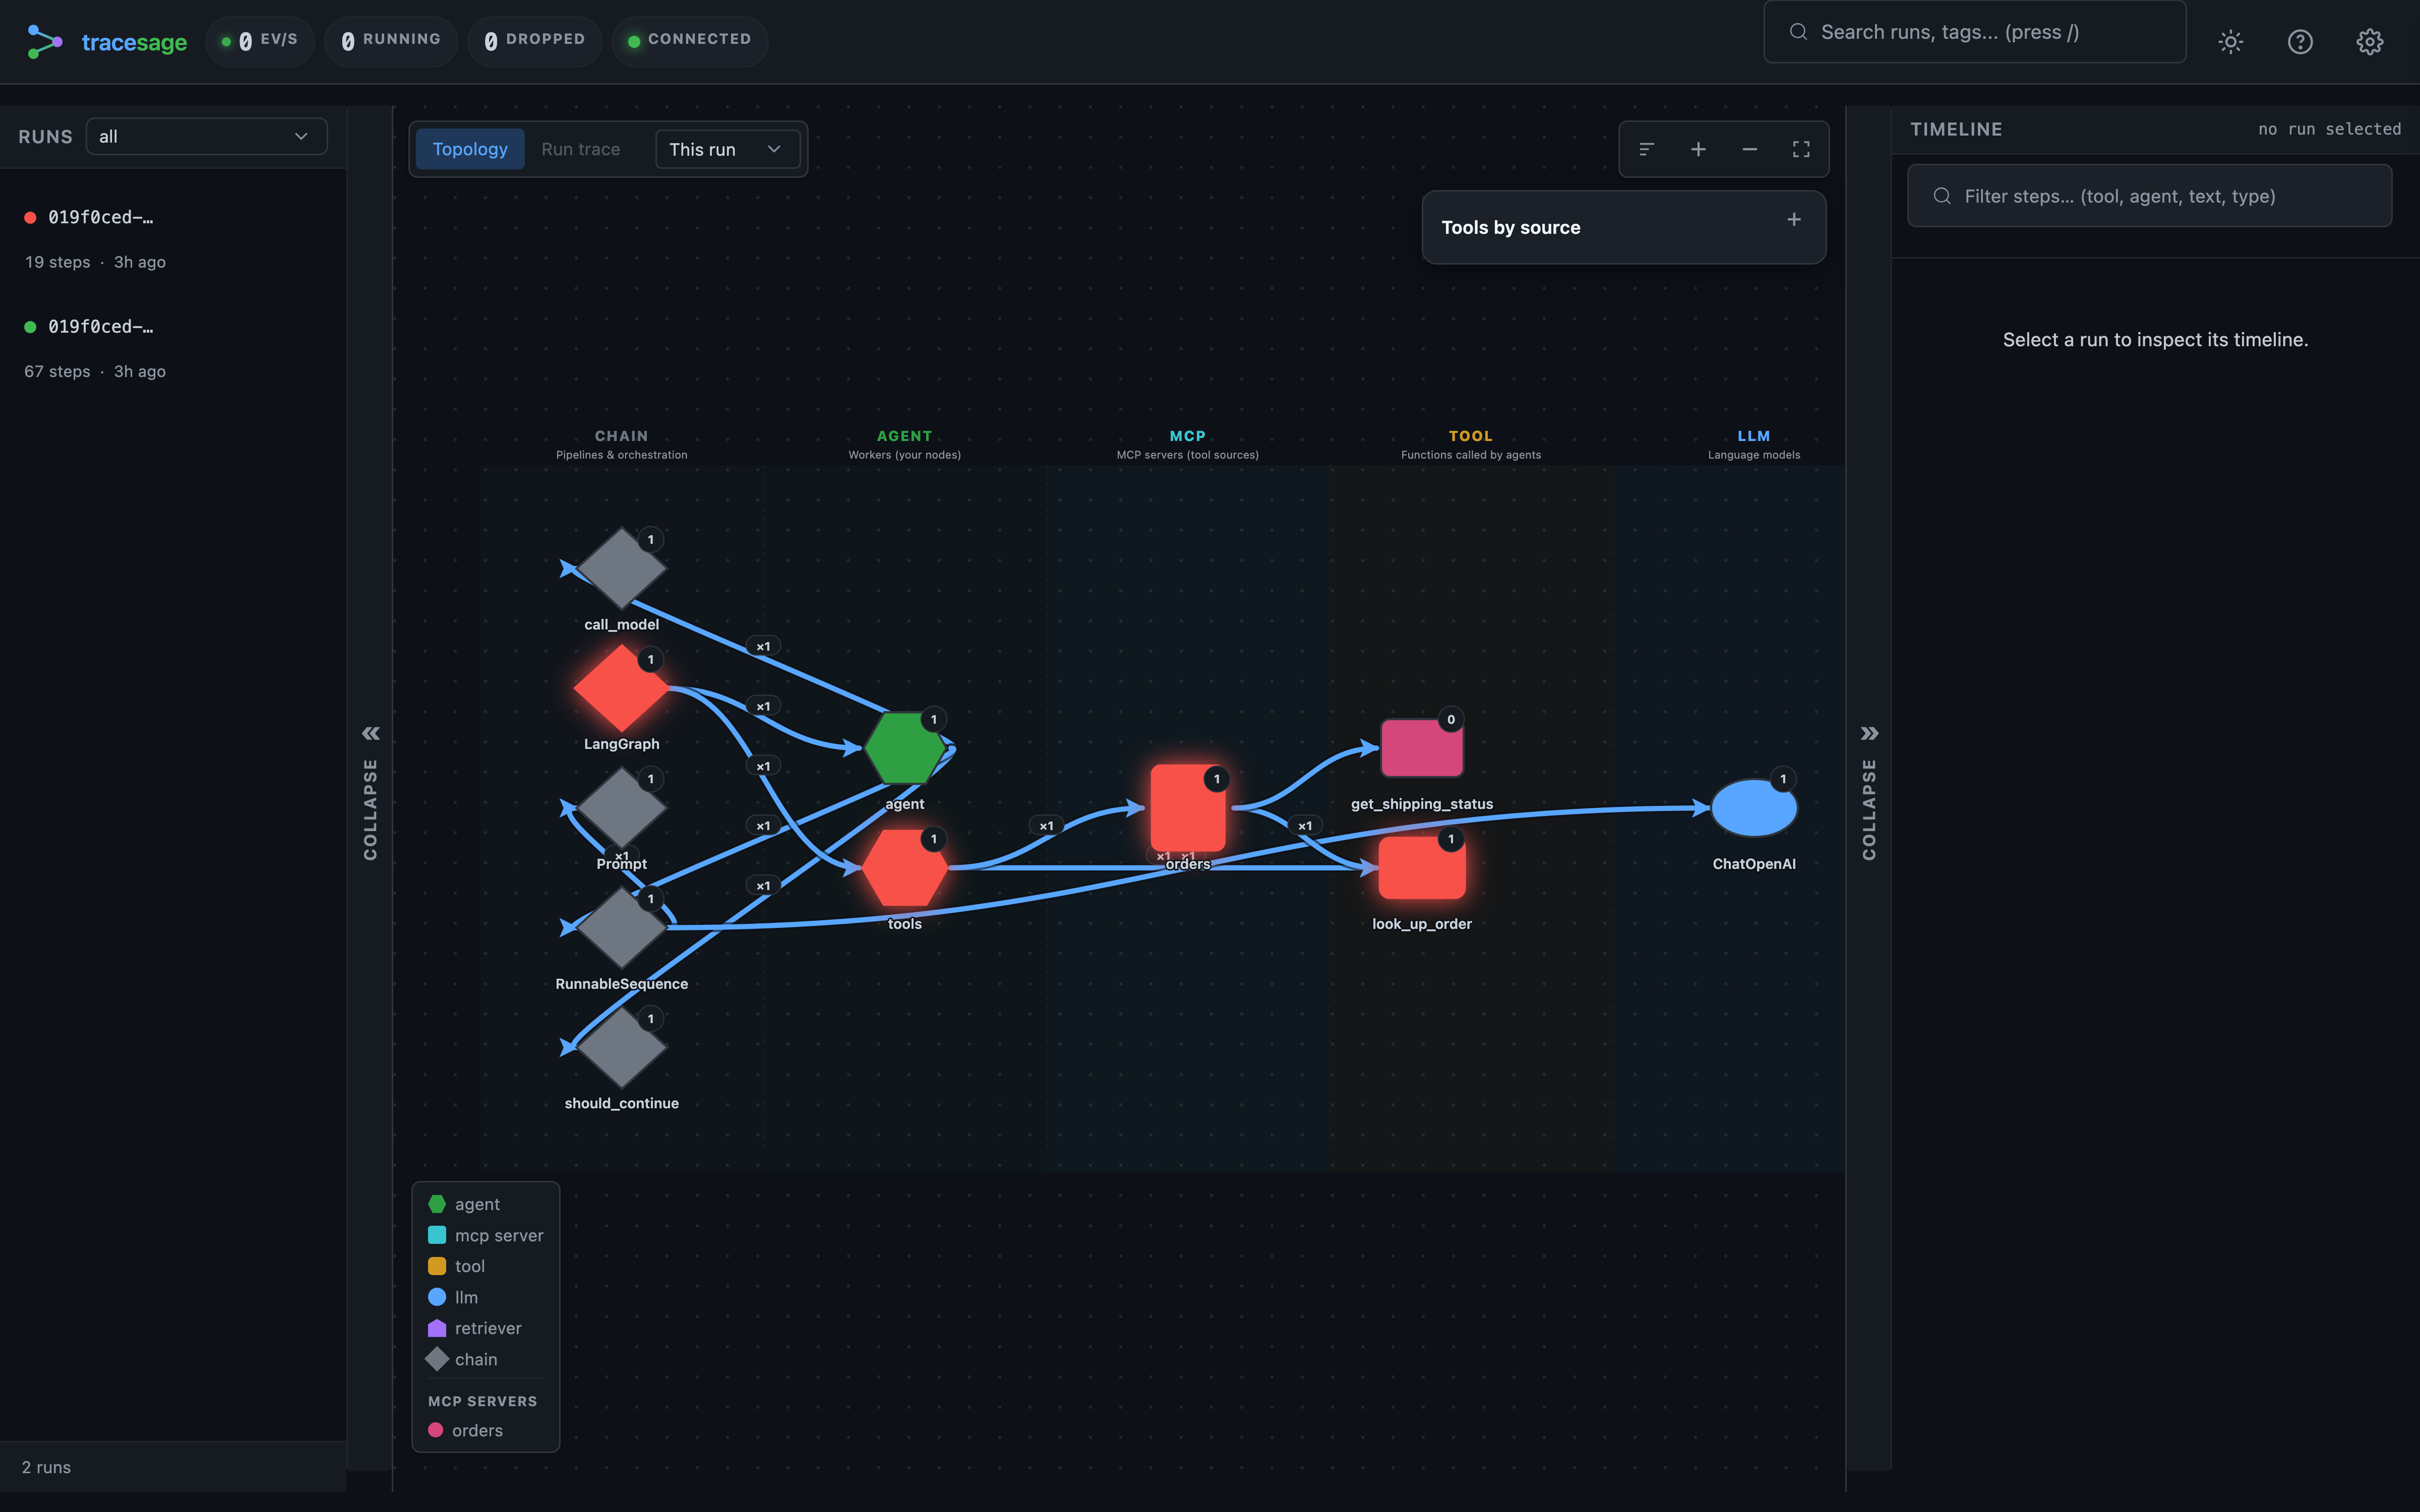
 |
 |
| Run-trace — the exact path a run took, with timeline and step-through replay. | When something breaks, a red node pins the exact tool and error. |
Once a run lands, the UI shows:
- Run list — every run with status, tags, started-at, total steps, total tokens, and a toast when a watched run completes or fails
- Graph pane — toggles between two views:
- Topology — agent / tool / chain / retriever relationships by kind, scoped to the selected run by default (a toolbar selector switches to last-N-runs / all-time)
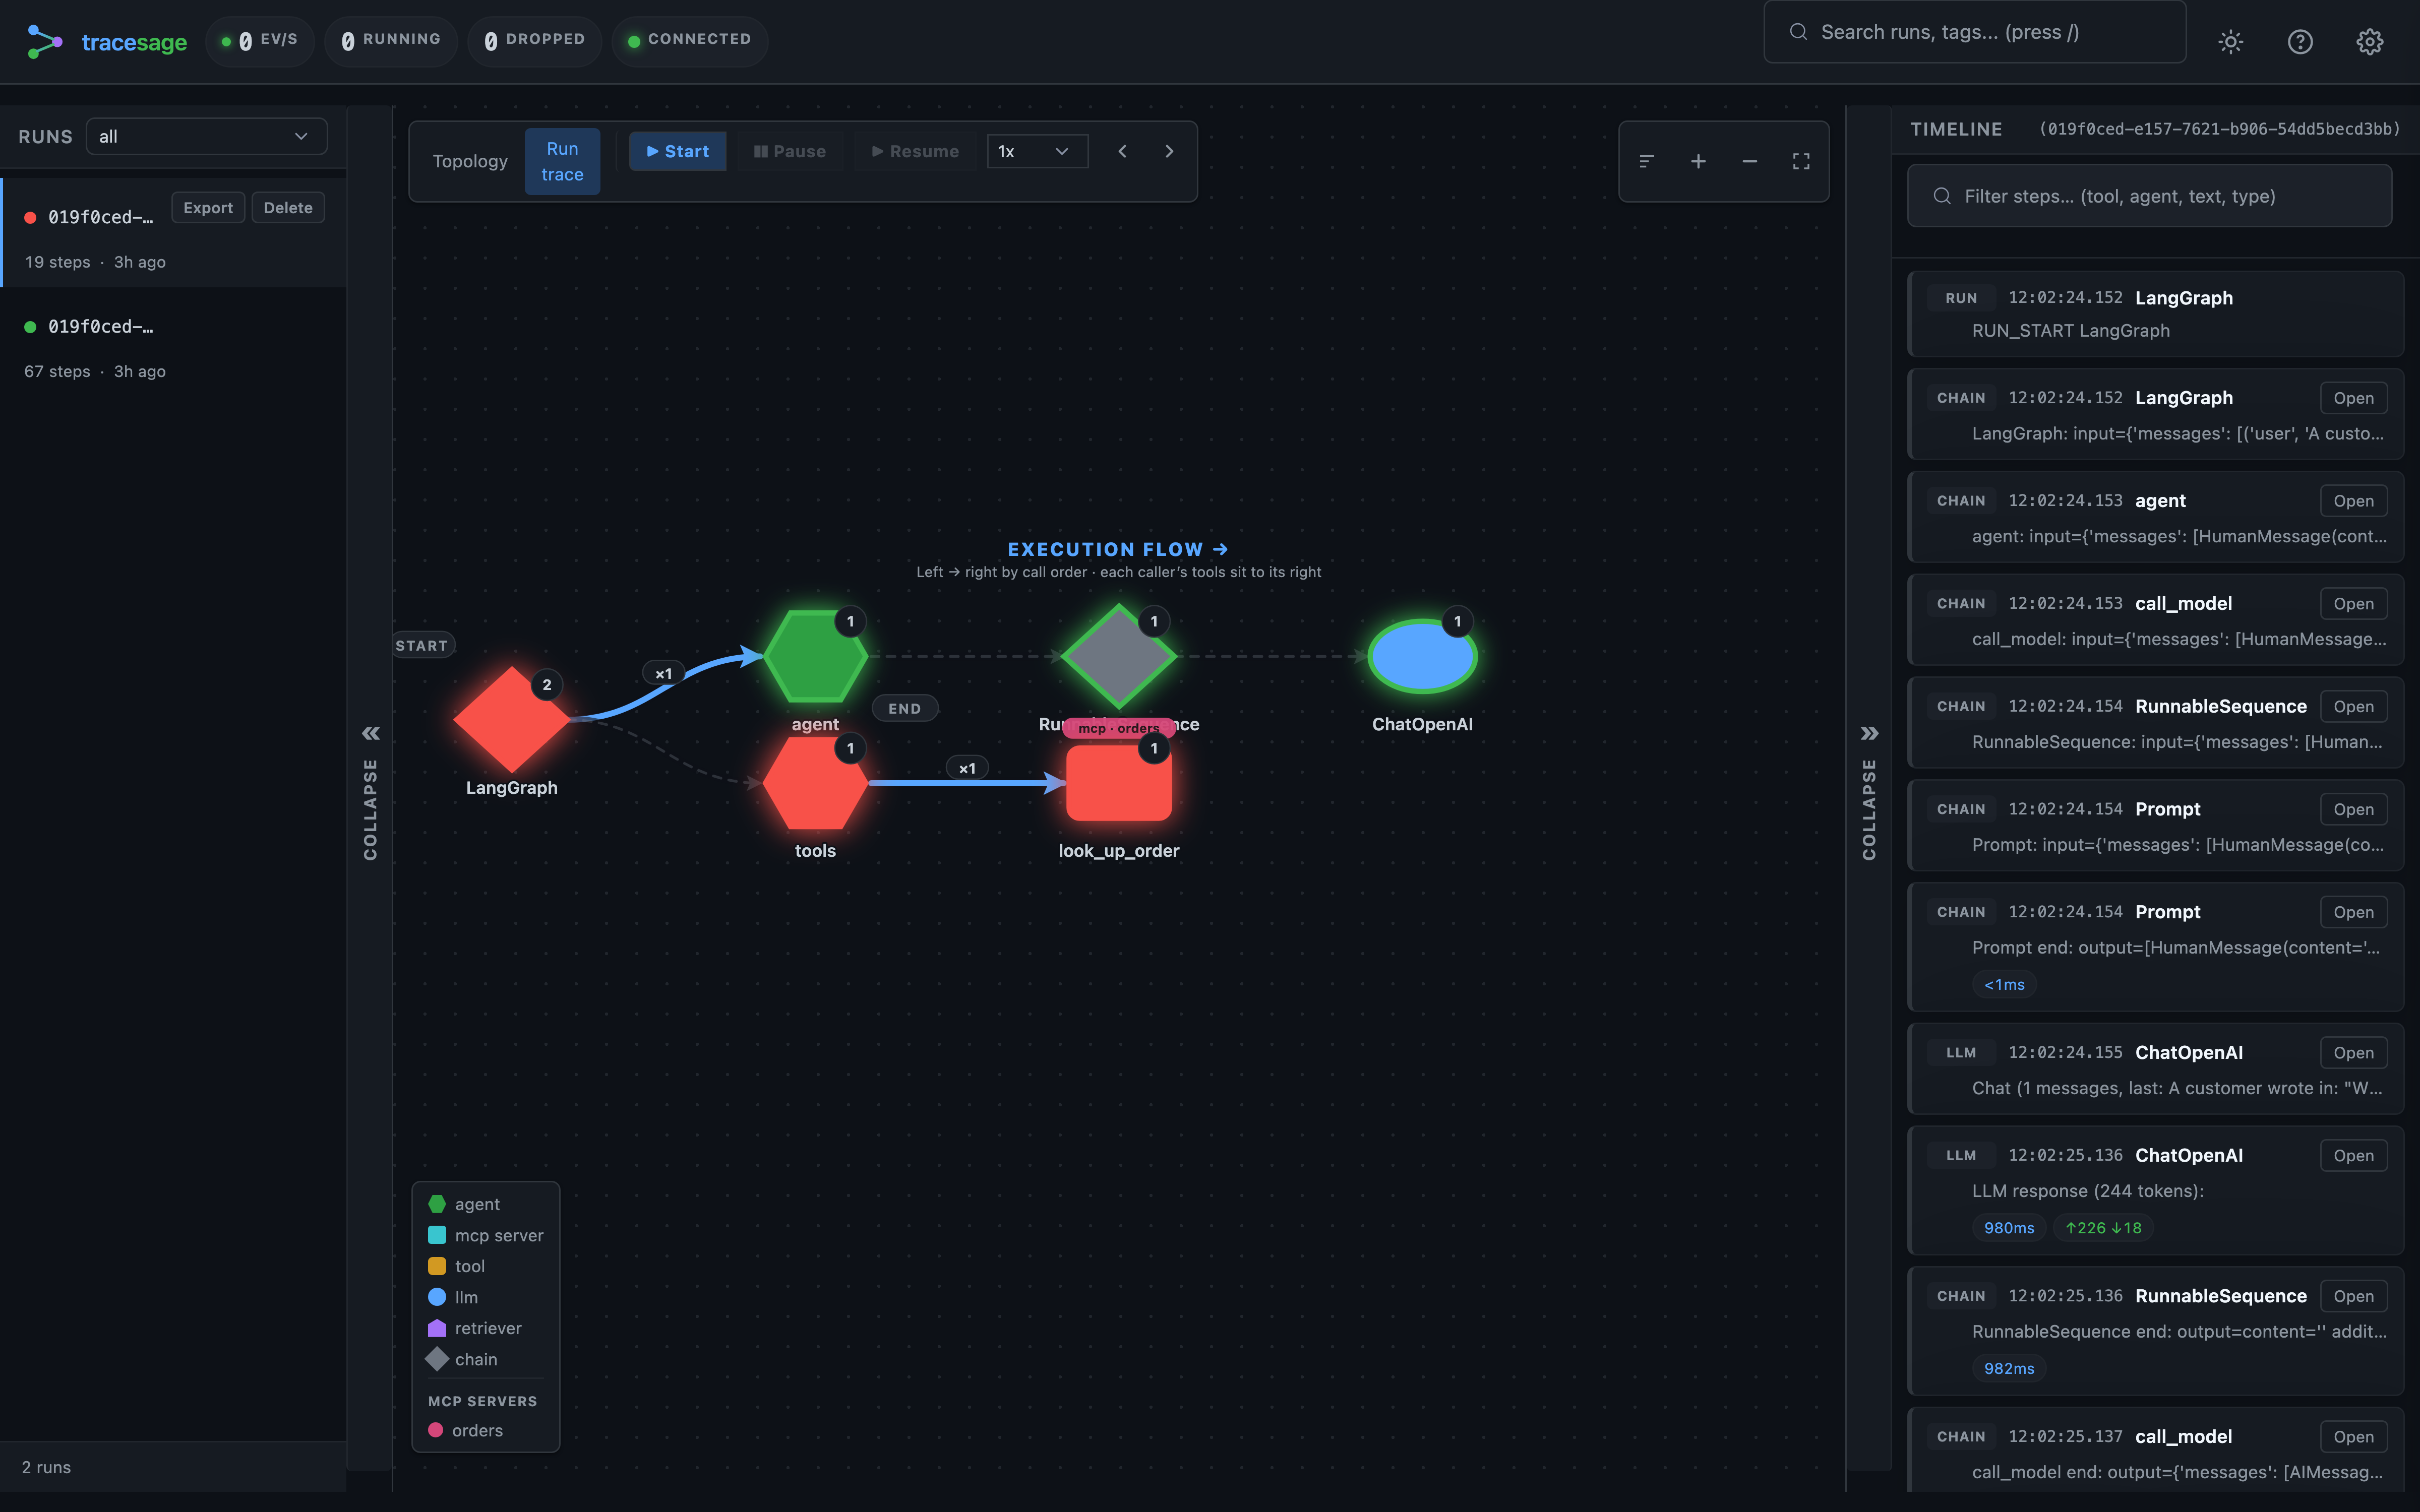
- Run-trace — one selected run laid out as a left → right call tree in call order
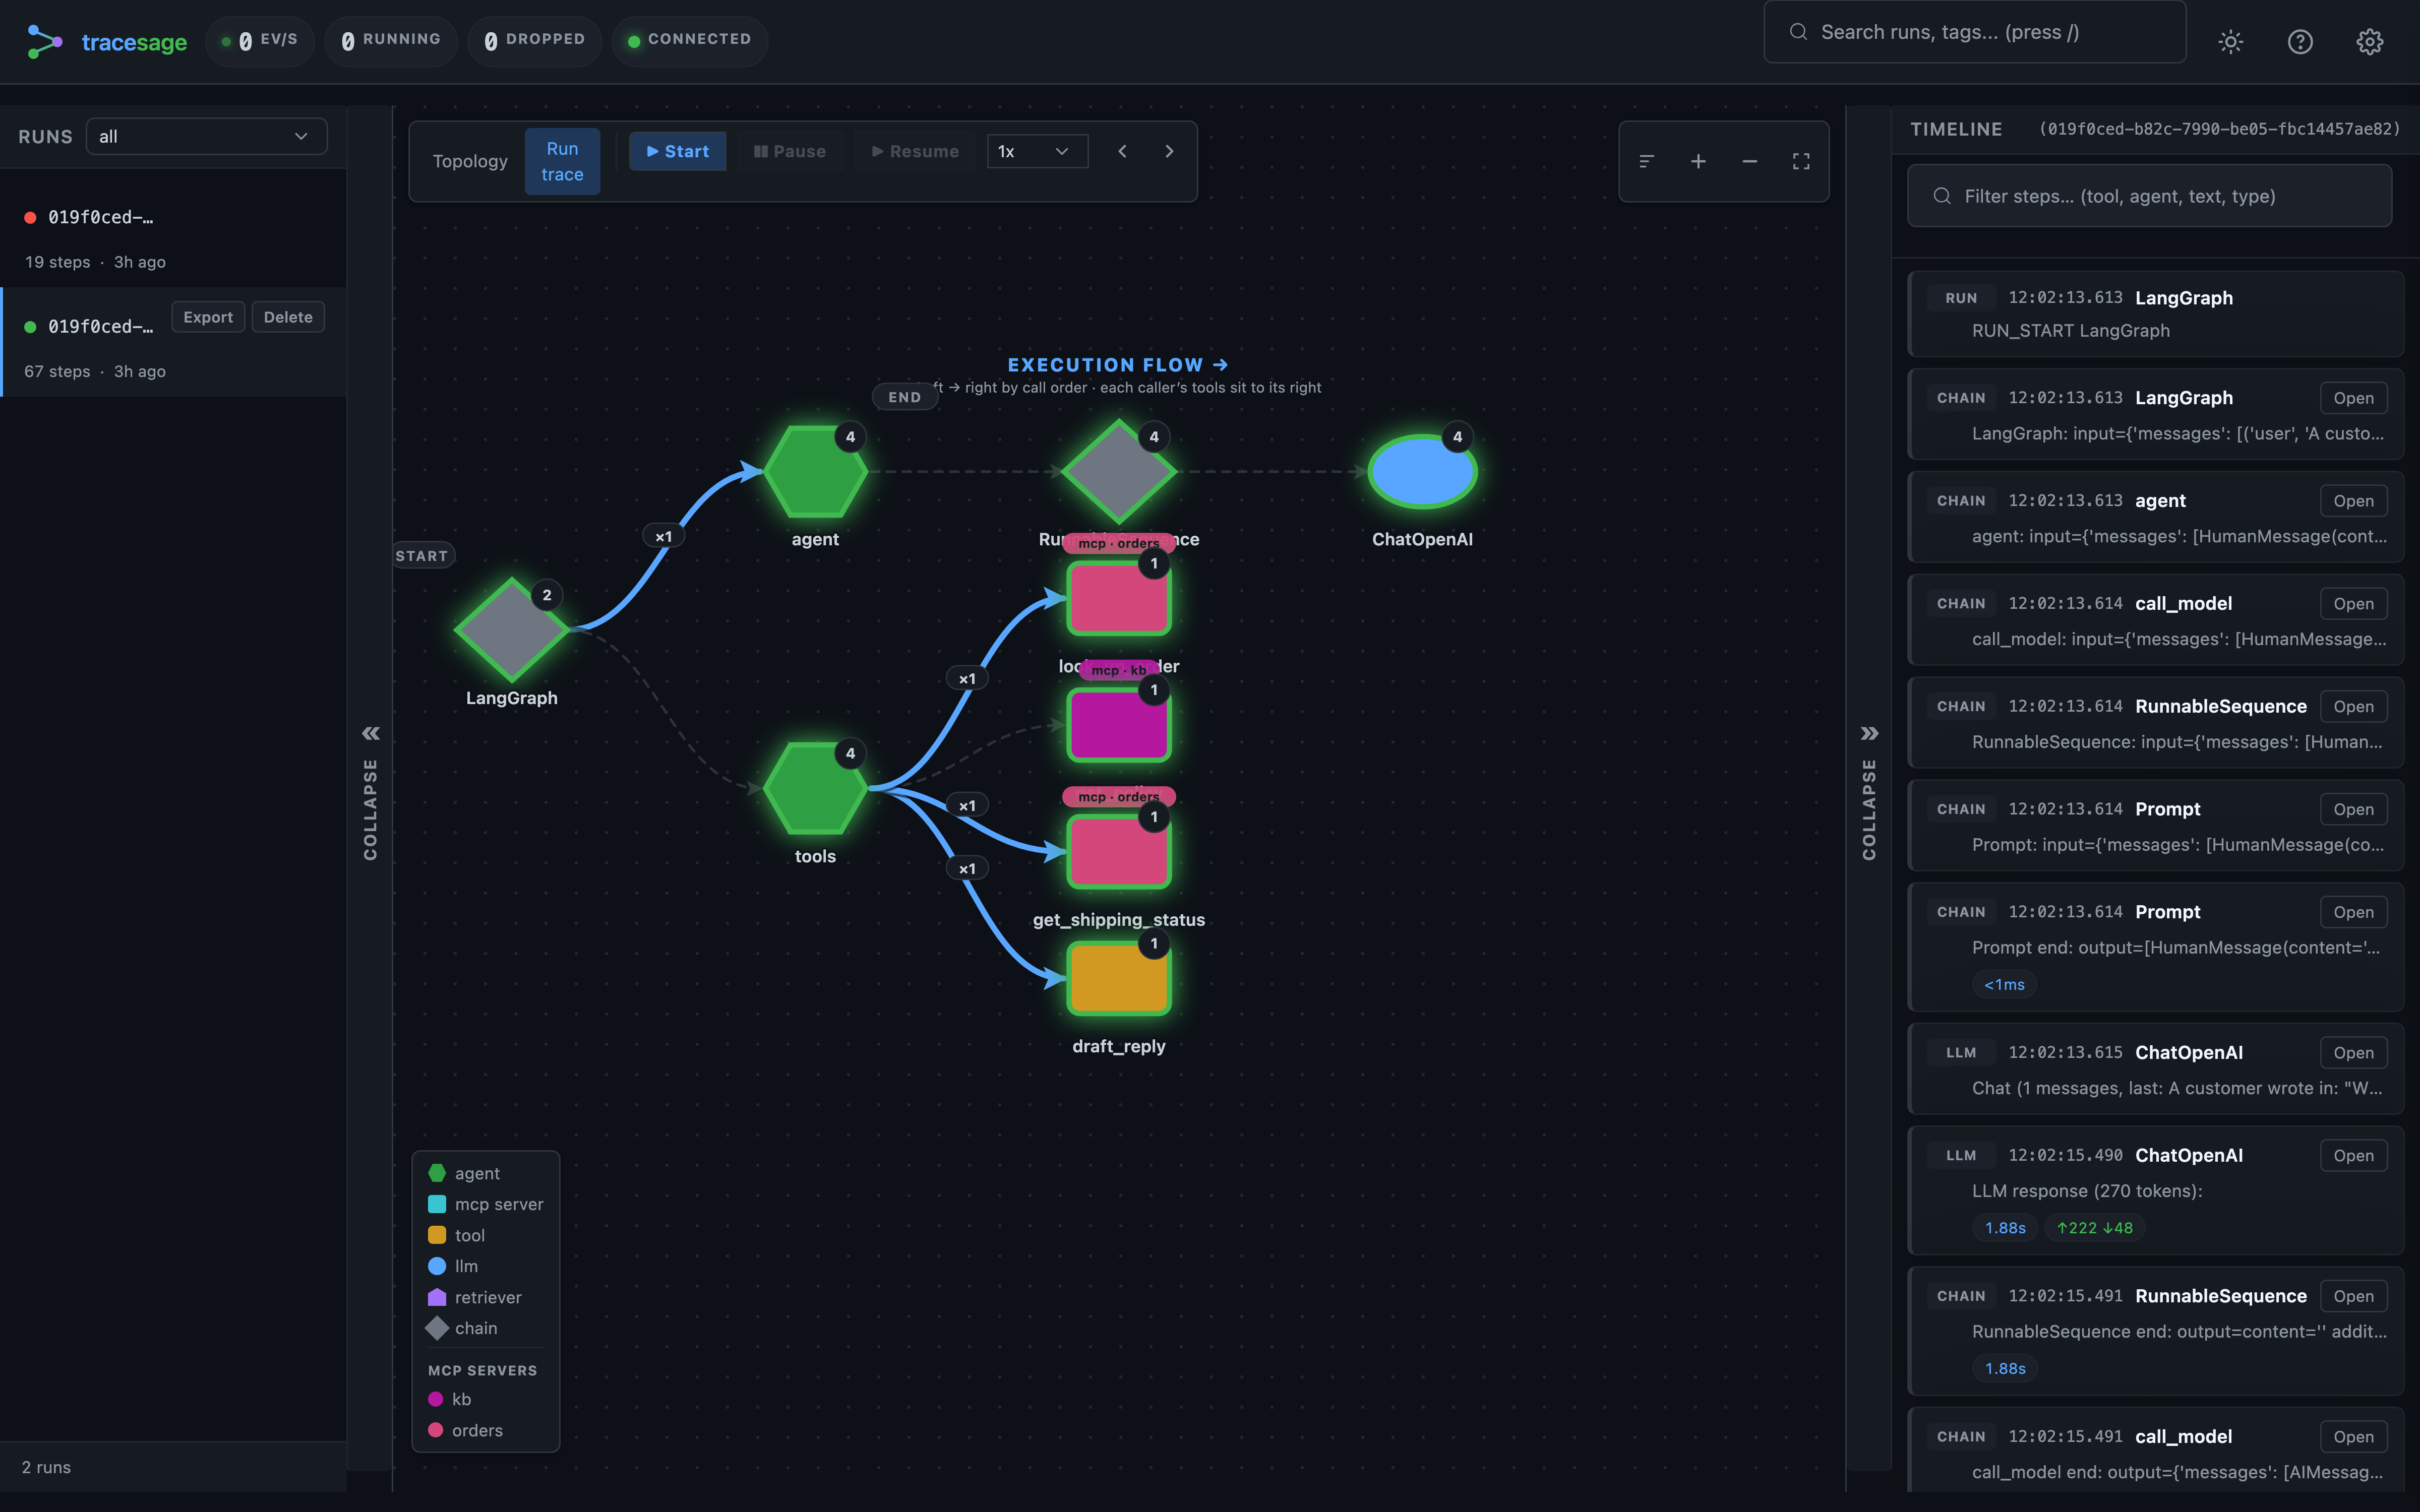
- Timeline — chronological steps; a
*_startshows its request, a*_endthe full request + response payloads (MCP-backed tools are tagged with their server) - Step-through replay — explicit Start / Pause / Resume plus Prev / Next manual stepping (1x / 2x / 5x); clicking a timeline step jumps the cursor there
- Node inspector — click any node for its stats; LLM nodes show token usage (in / out)
Keyboard: j / k next/prev run, / focus search, t theme, Esc close, ? help.
Header stats
The top bar shows live health at a glance (plus the optional project name next to the brand):
| Chip | Meaning |
|---|---|
| ev/s | Trace events received per second, as a 1-minute rolling average (events in the last 60 s ÷ 60). A quick pulse that capture is flowing — it rises while a run is active and decays to 0 when idle. |
| running | How many root runs are currently in progress (runs_active from /api/stats; falls back to counting running rows in the list). |
| dropped | Events dropped because the ingestion queue was full (backpressure). Should stay 0; the chip turns red if not. If it climbs, lower sample_rate or raise queue_maxsize — see Deploying & hardening → what to monitor. |
| connection dot | The live WebSocket link to the server: connected (updates streaming in real time), connecting, or disconnected (it auto-reconnects with backoff). |
ev/s is computed in the browser from the event stream; running and dropped
come from GET /api/stats, polled periodically.
Watch a trace stream in
Inspect any node
Click a node to open its drawer — counts, durations, errors, the tools it provides or uses, and (for MCP) its server of origin. LLM nodes show token usage (in / out, total across calls).
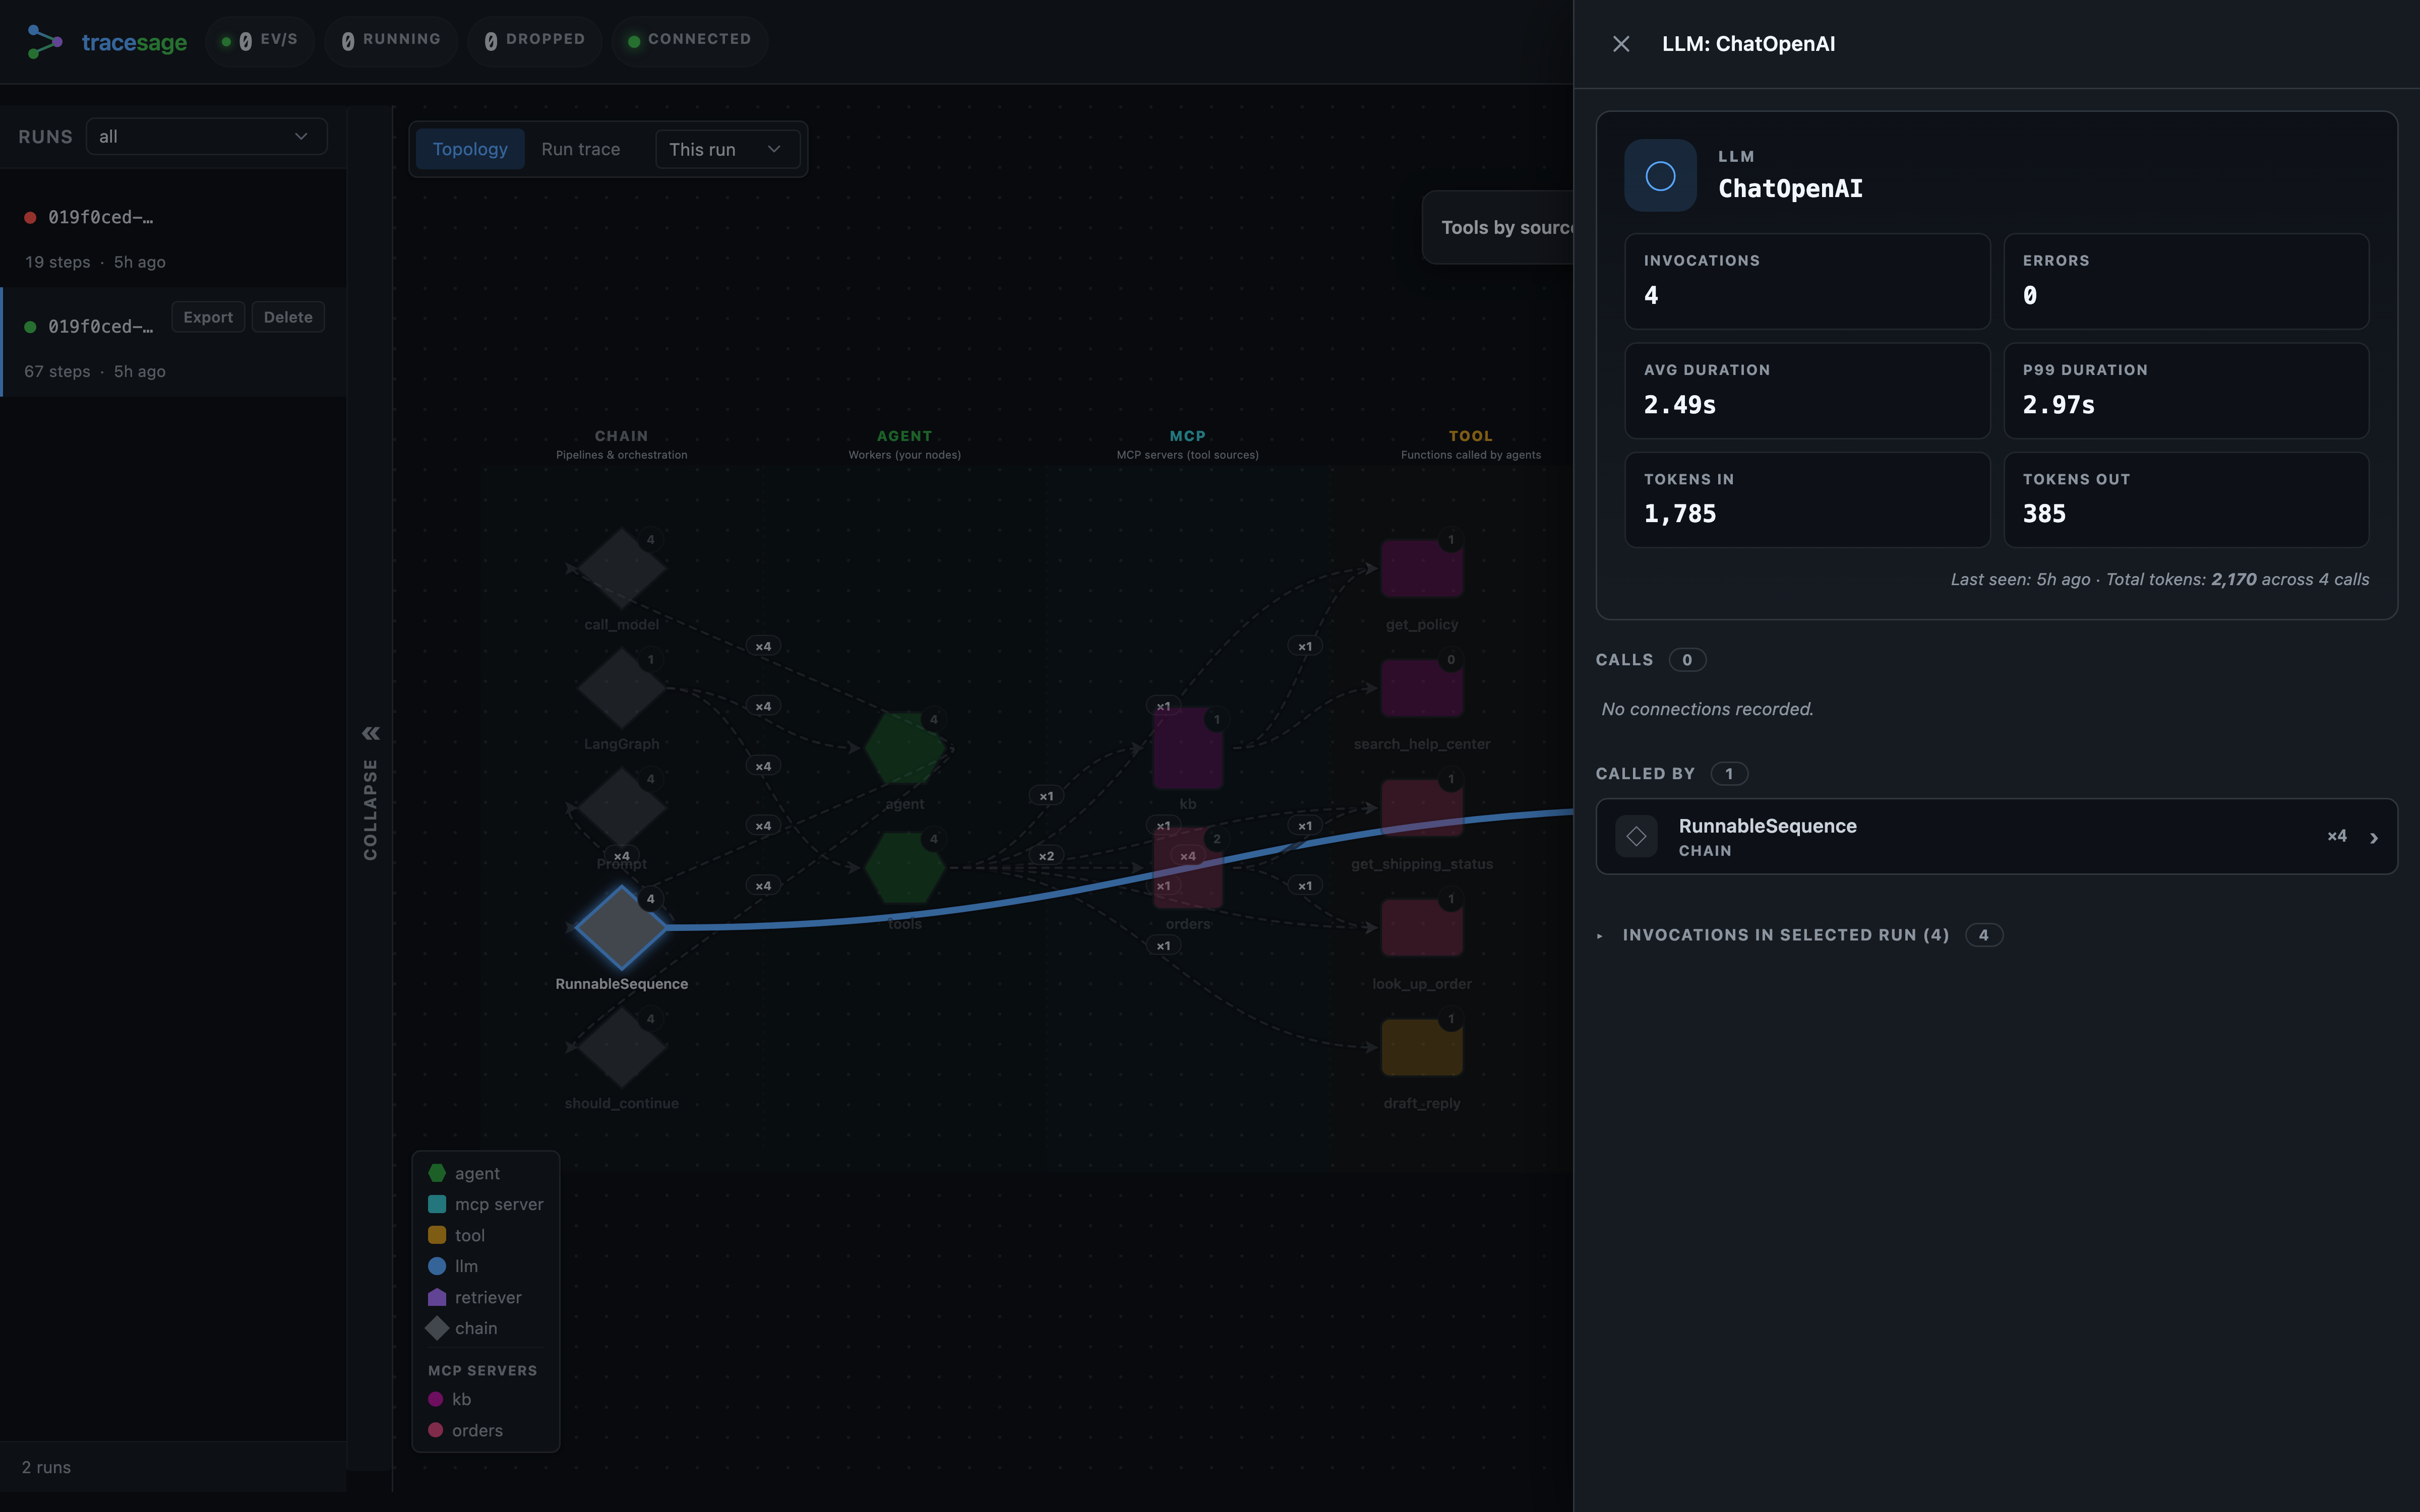 |
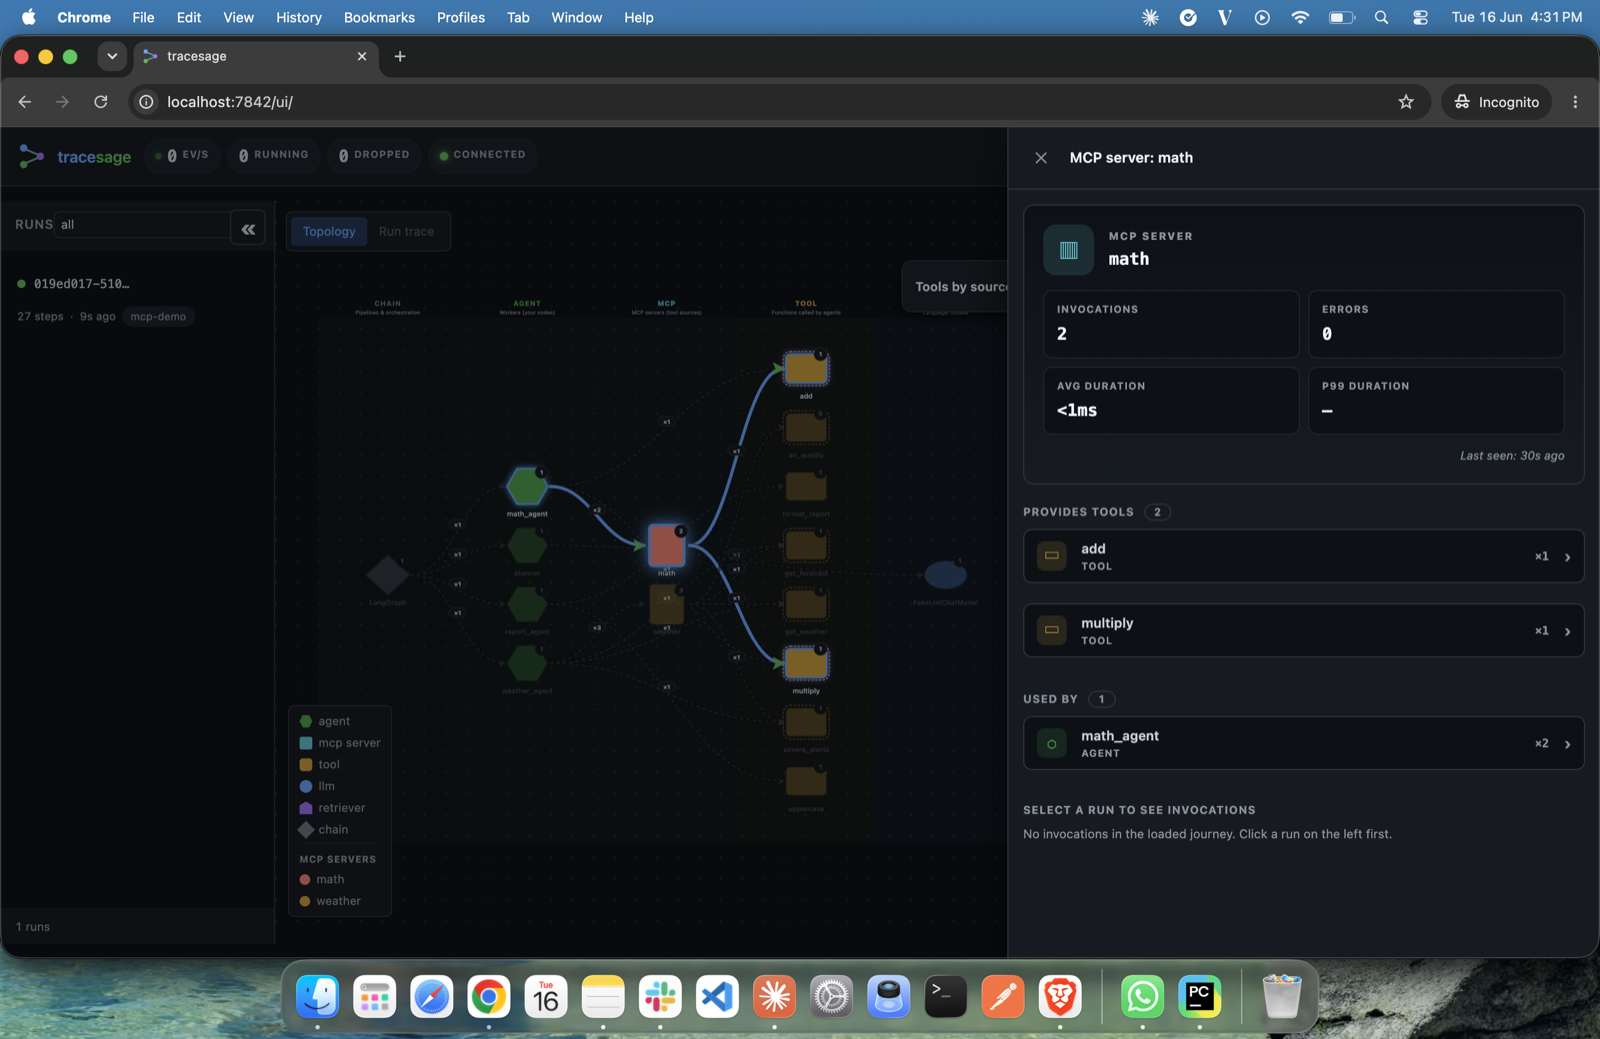 |
| LLM inspector — token usage (in / out, total across calls) and latency. | MCP server inspector — provided tools, invocations and callers. |
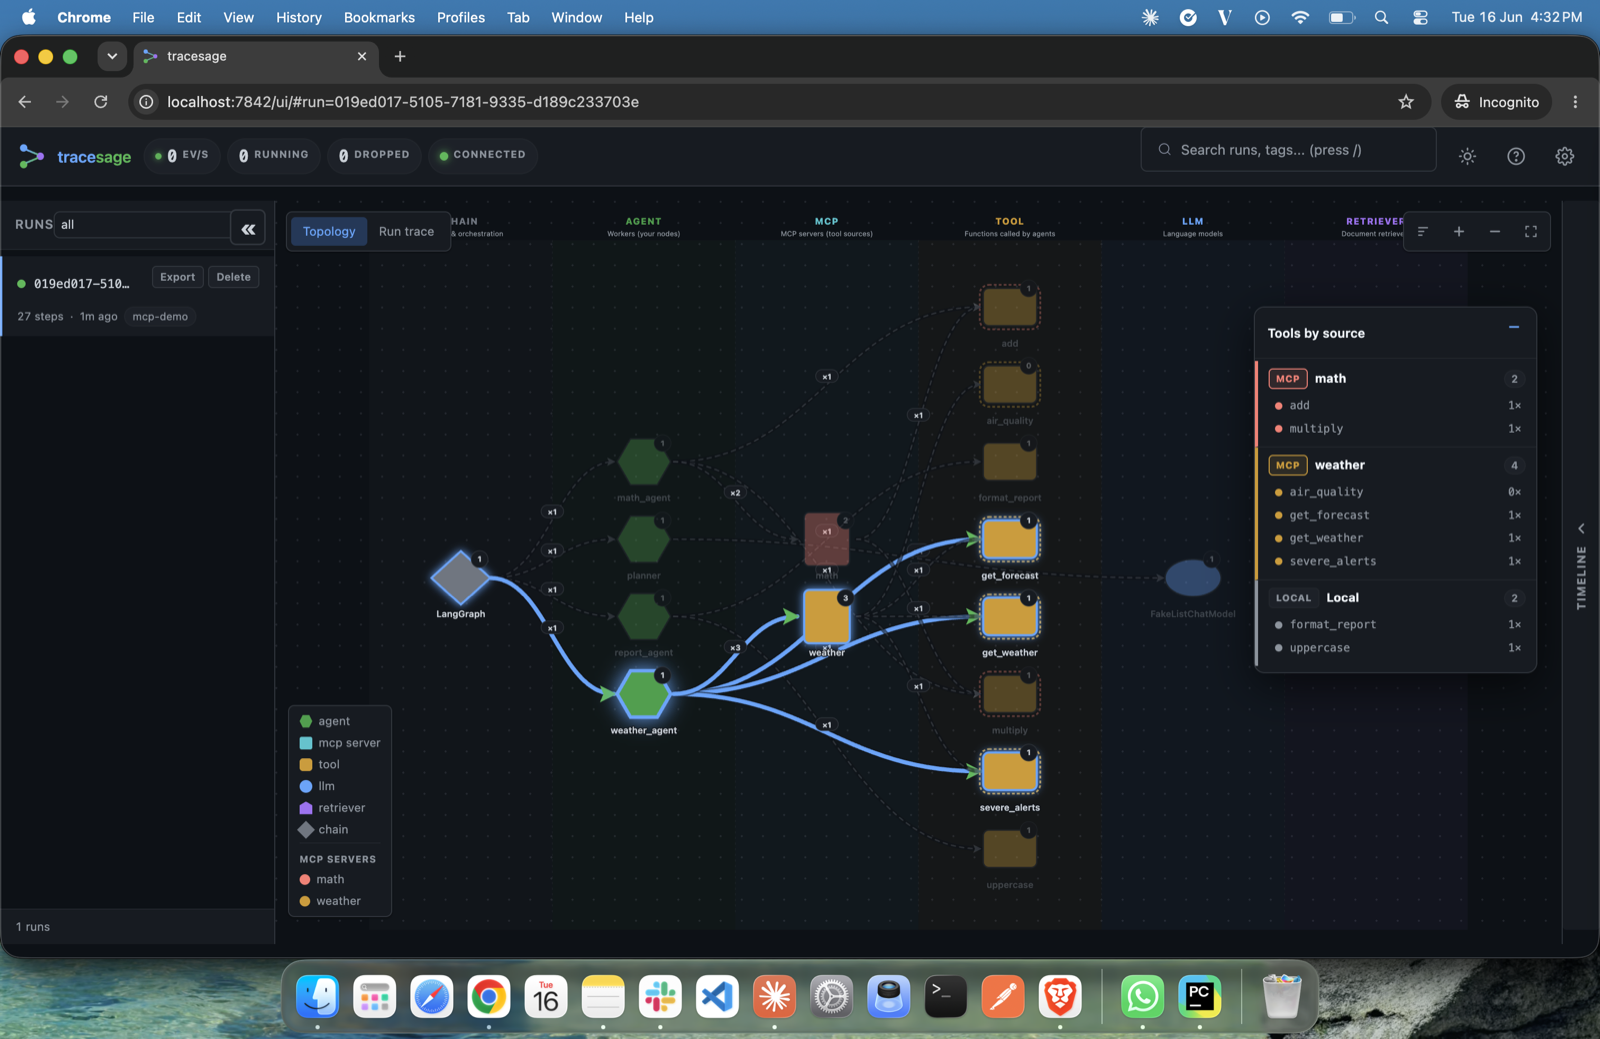 |
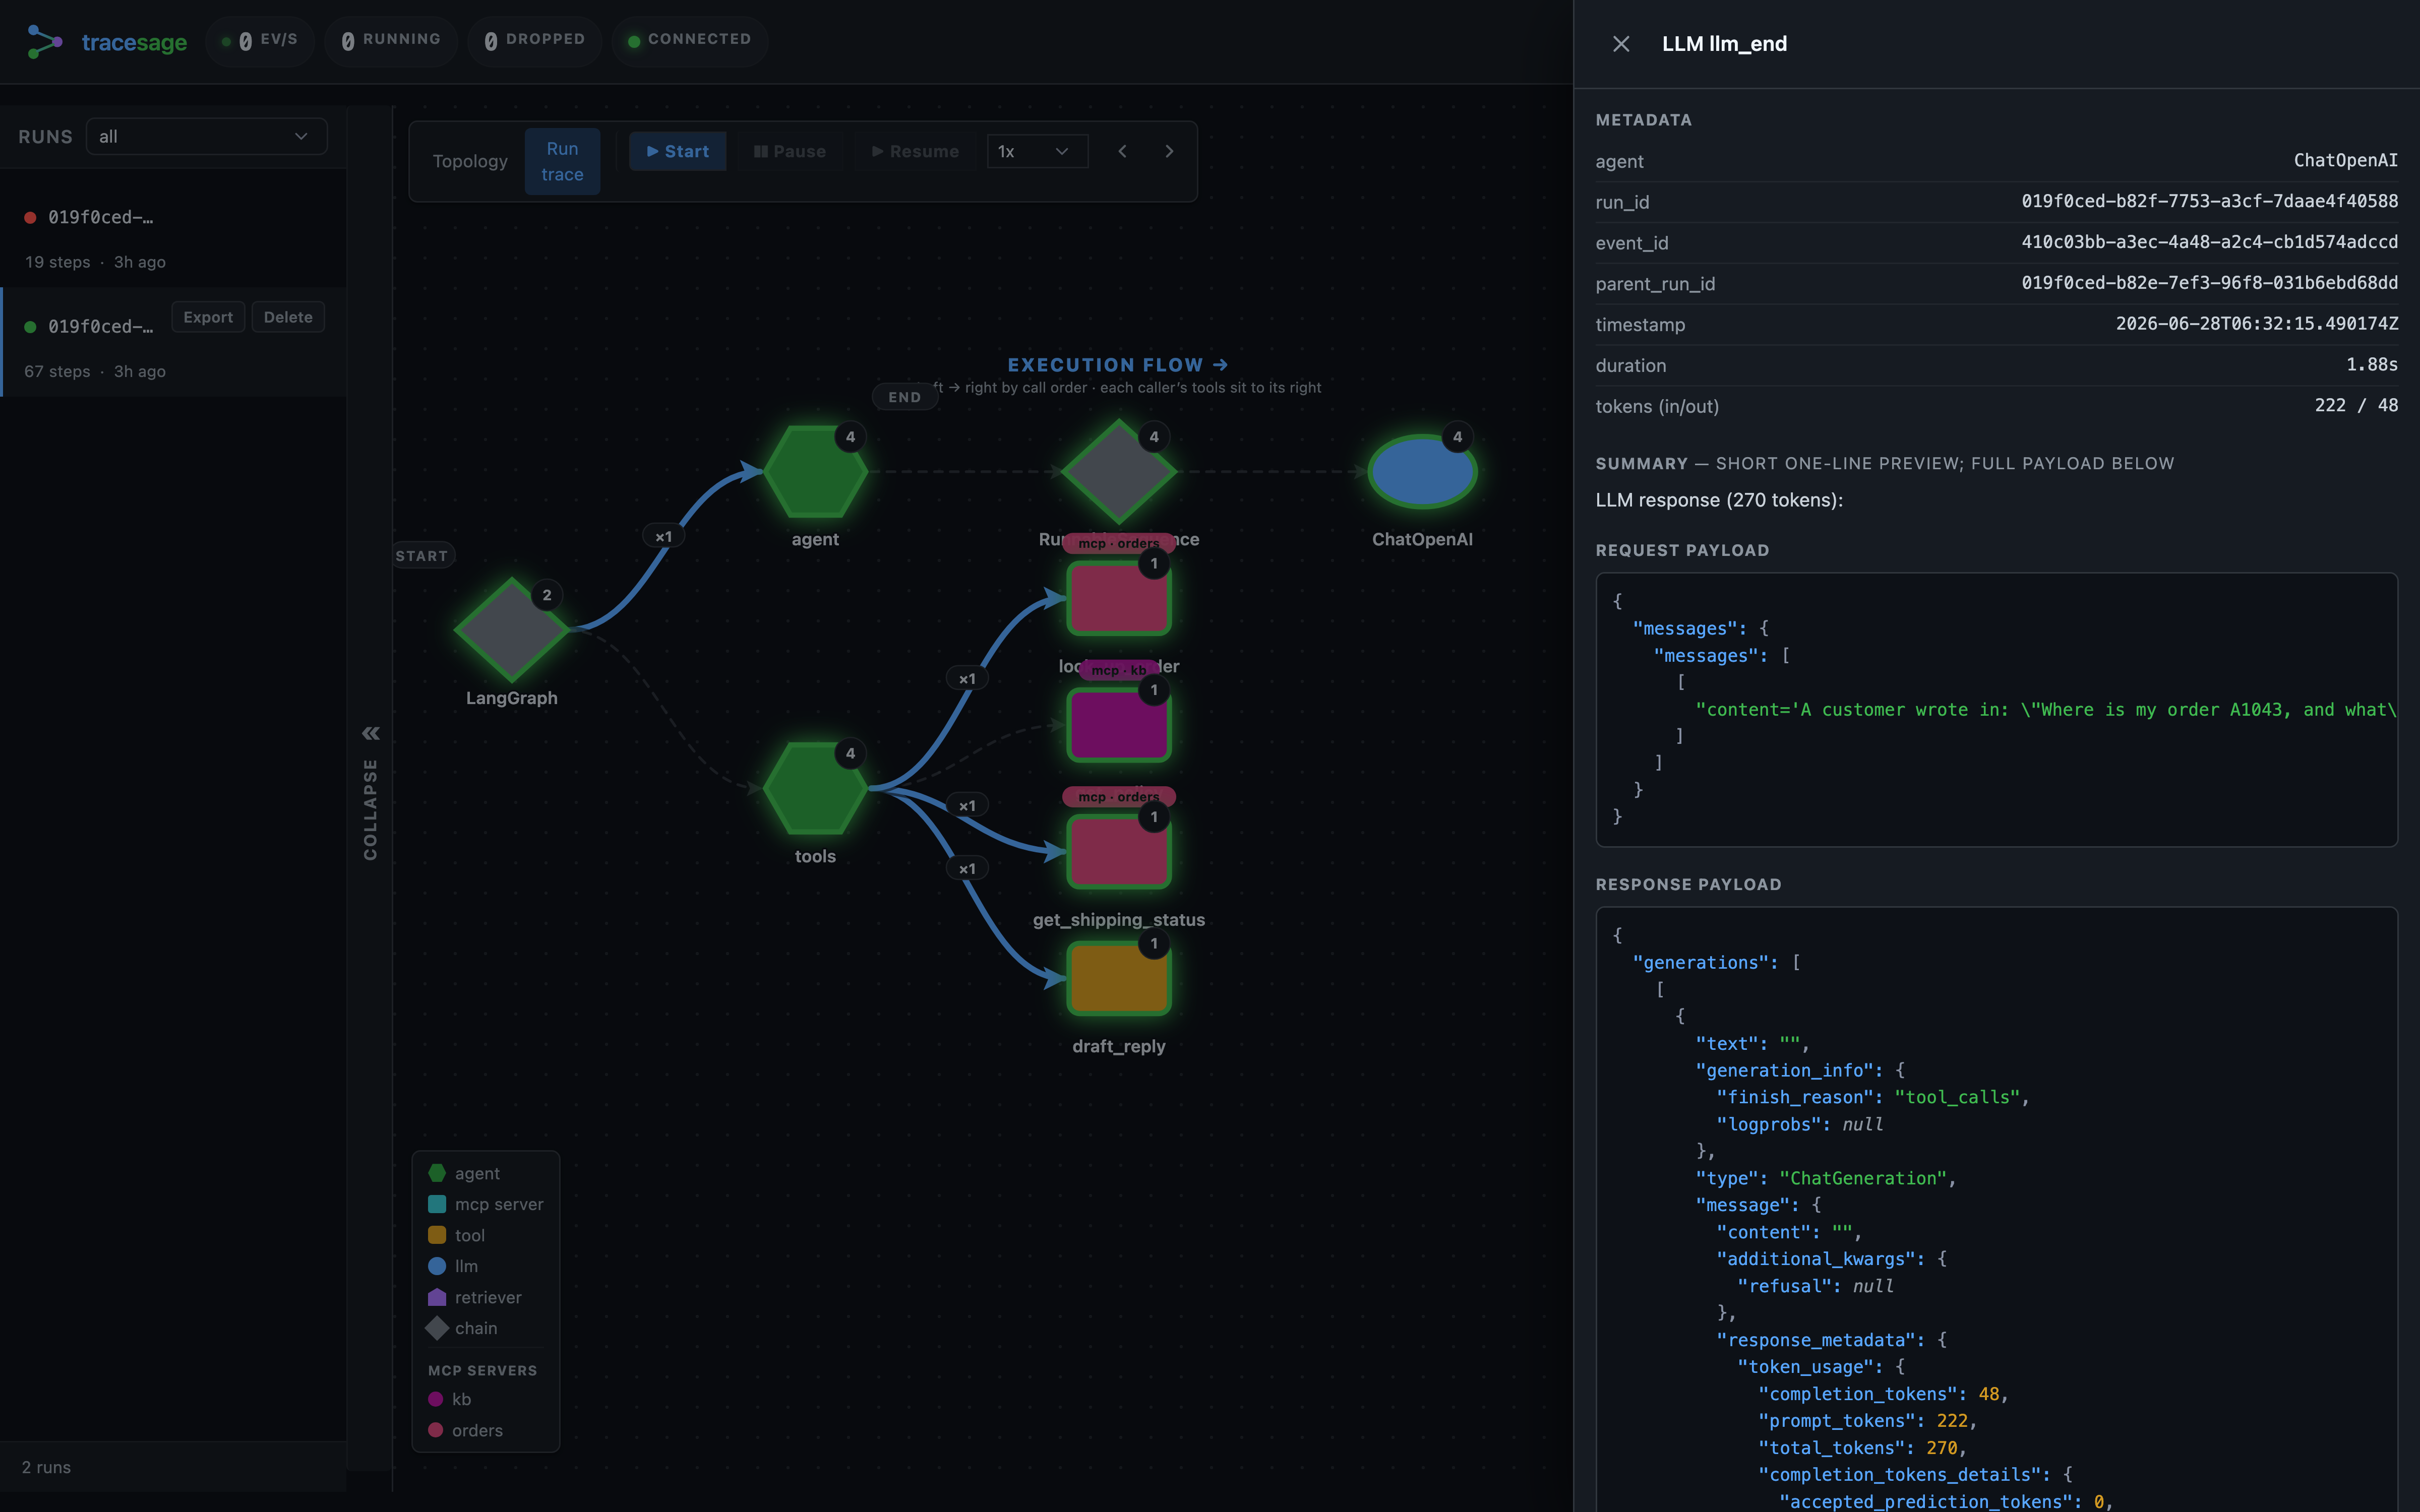 |
| “Tools by source” — tools grouped by origin (MCP vs. local). | Any step → its full request and response payloads. |
Status
Beta. API may still shift before v1.0. The PyPI badge shows the published version, stamped by the release workflow when a version actually ships (so it matches PyPI). Built for local development and single-process tracing, with OpenTelemetry export to bridge into a central stack; native multi-process / remote-collector storage is on the roadmap. Today the only shipped adapter is LangChain / LangGraph — the core is framework-neutral and CrewAI / AutoGen / LlamaIndex adapters are planned, not yet available. See the changelog for release notes.