MCP tool-source attribution
When your agent's tools come from Model Context Protocol
servers (loaded via langchain-mcp-adapters),
tracesage can attribute each tool call to the MCP server it came from — so you can
see, at a glance, "these 10 tools came from 2 MCP servers; these 2 are hardcoded
in my workflow."
Install
MCP support is an optional extra (the core package never imports it):
The [mcp] extra installs langchain-mcp-adapters>=0.1.0, mcp>=1.0.0, and langgraph.
If you already manage those yourself, any langchain-mcp-adapters>=0.1.0 works.
Register tool sources
LangChain tools don't reliably carry their originating MCP server, so tracesage records the mapping explicitly. Do this once at setup, before invoking your graph:
from langchain_mcp_adapters.client import MultiServerMCPClient
from tracesage import TraceSage
from tracesage.adapters.mcp import register_mcp_client

tracer = await TraceSage.create()

client = MultiServerMCPClient({
    "weather": {"command": "python", "args": ["weather_server.py"], "transport": "stdio"},
    "math":    {"command": "python", "args": ["math_server.py"],    "transport": "stdio"},
})

# Loads every server's tools AND records tool -> server provenance.
mcp_tools = await register_mcp_client(tracer, client)

# Your own @tool functions stay "local" (unattributed) automatically.
all_tools = mcp_tools + [my_local_tool]
register_mcp_client is async (loading tools from MultiServerMCPClient is async). In
a synchronous app, load + register inside an asyncio.run(...) startup block, then use the
returned tools with your sync agent.
If you load tools per server yourself, attribute them explicitly (this call is sync):
from tracesage.adapters.mcp import register_mcp_tools
register_mcp_tools(tracer, weather_tools, server="weather")
Or register a single tool name:
Auto-detection (best-effort)
Even without registration, tracesage tags a tool whose call carries
metadata={"mcp_server_name": "..."}. Explicit registration is the reliable path;
auto-detection is a fallback.
Where it shows up
- UI — a "Tools by source" panel (top-right of the graph pane) groups tools as
MCP: weather (4) · MCP: math (2) · Local (2). Clicking a tool node shows its source in the drawer. - REST —
GET /api/toolsreturns the grouped inventory; topology tool nodes carry asourcefield. See the API reference. - Storage — provenance is persisted on each tool event (
events.mcp_server), so it survives restarts and is visible intracesage servemode.
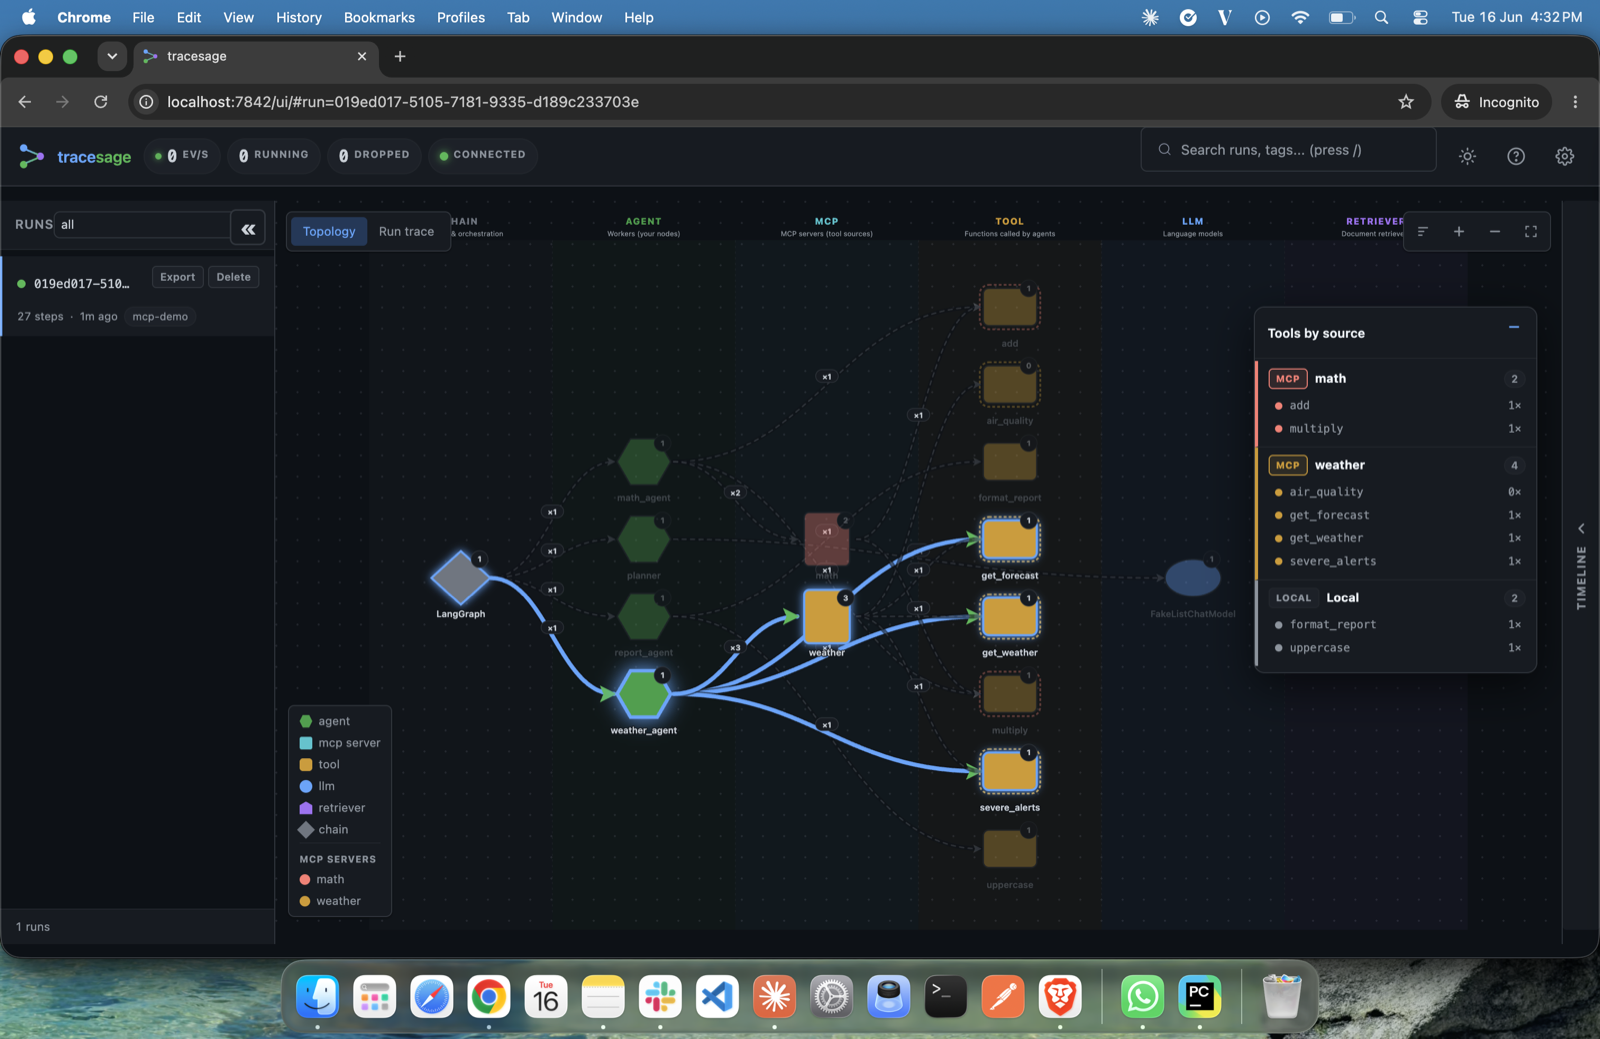
The "Tools by source" panel groups every tool by its MCP server (e.g. orders, kb) or marks it as Local.
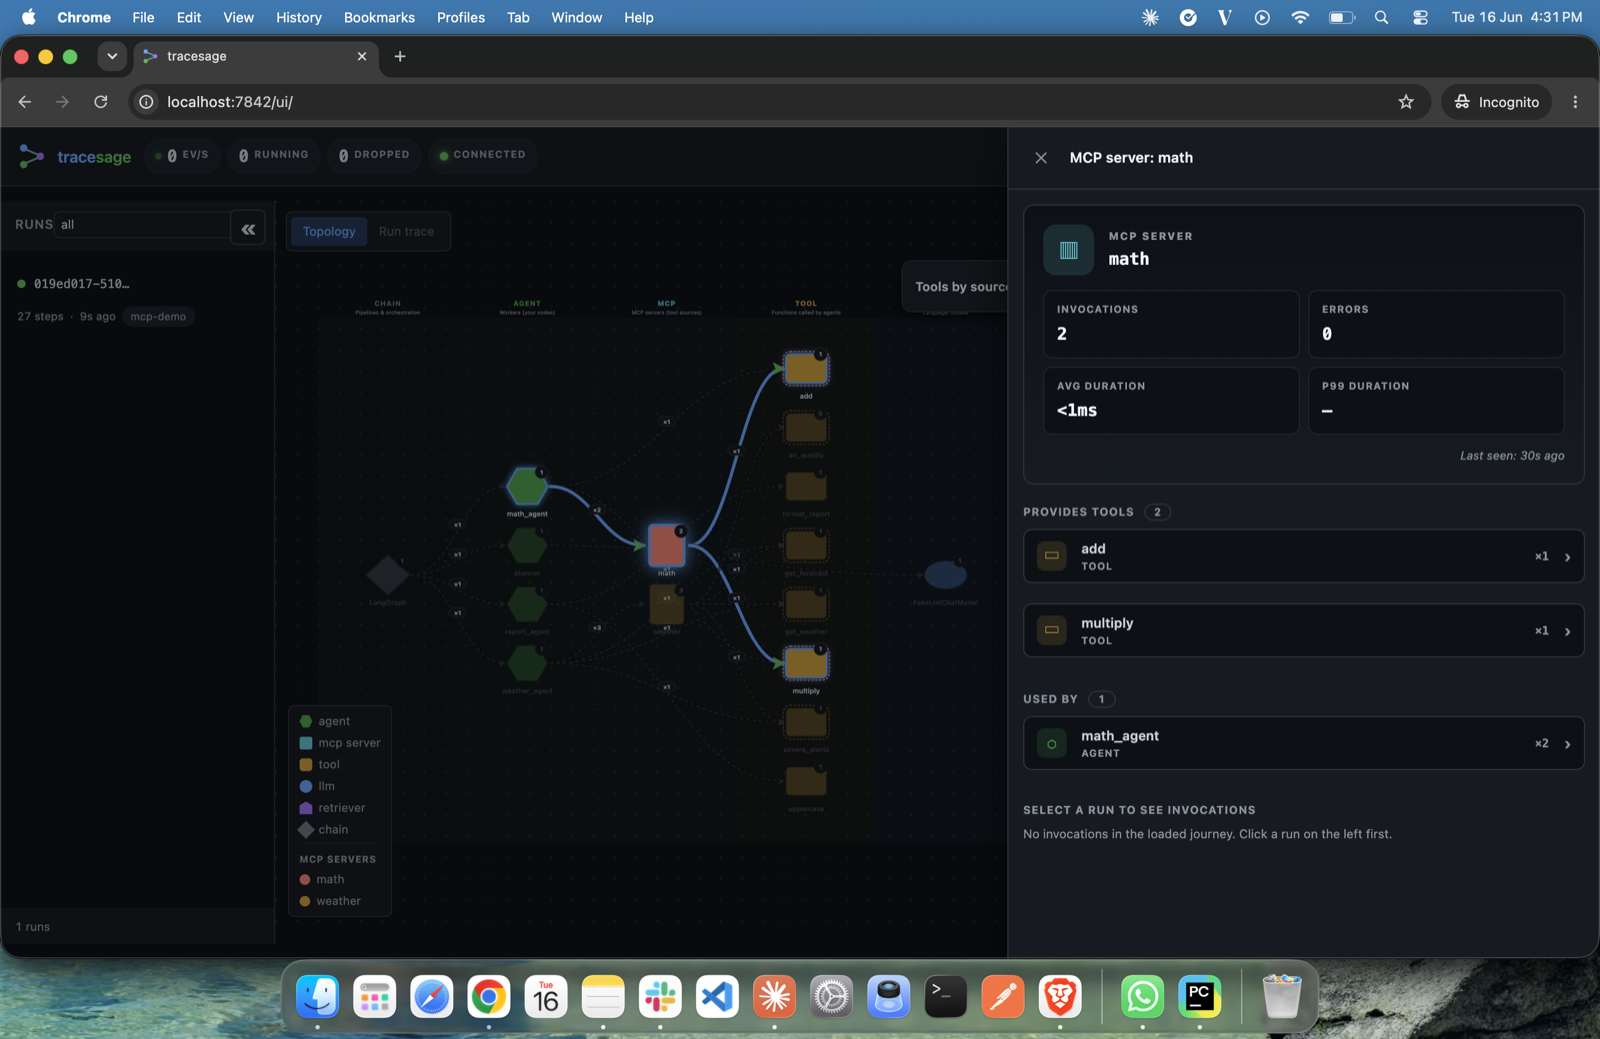
Clicking an MCP server node shows its invocations, errors, the tools it provides, and which agents use it.
Try it
Runnable MCP examples live in examples/mcp/.
Intro — two local stdio MCP servers + hardcoded tools, no API key:
Real-world demos — need an LLM API key: