Concepts: topology node kinds
When a run completes, tracesage groups every callback event into one of
five "kinds" of topology nodes — plus a synthesized mcp node when you
attribute tools to an MCP server:
agent · tool · llm · retriever · chain · mcp
This page is the reference for what each kind means, how tracesage classifies events into it, and why the distinction matters when you're debugging a run.
If you opened the UI after running an example and wondered "what does
agent:something vs chain:something mean?", this is the page.
At a glance
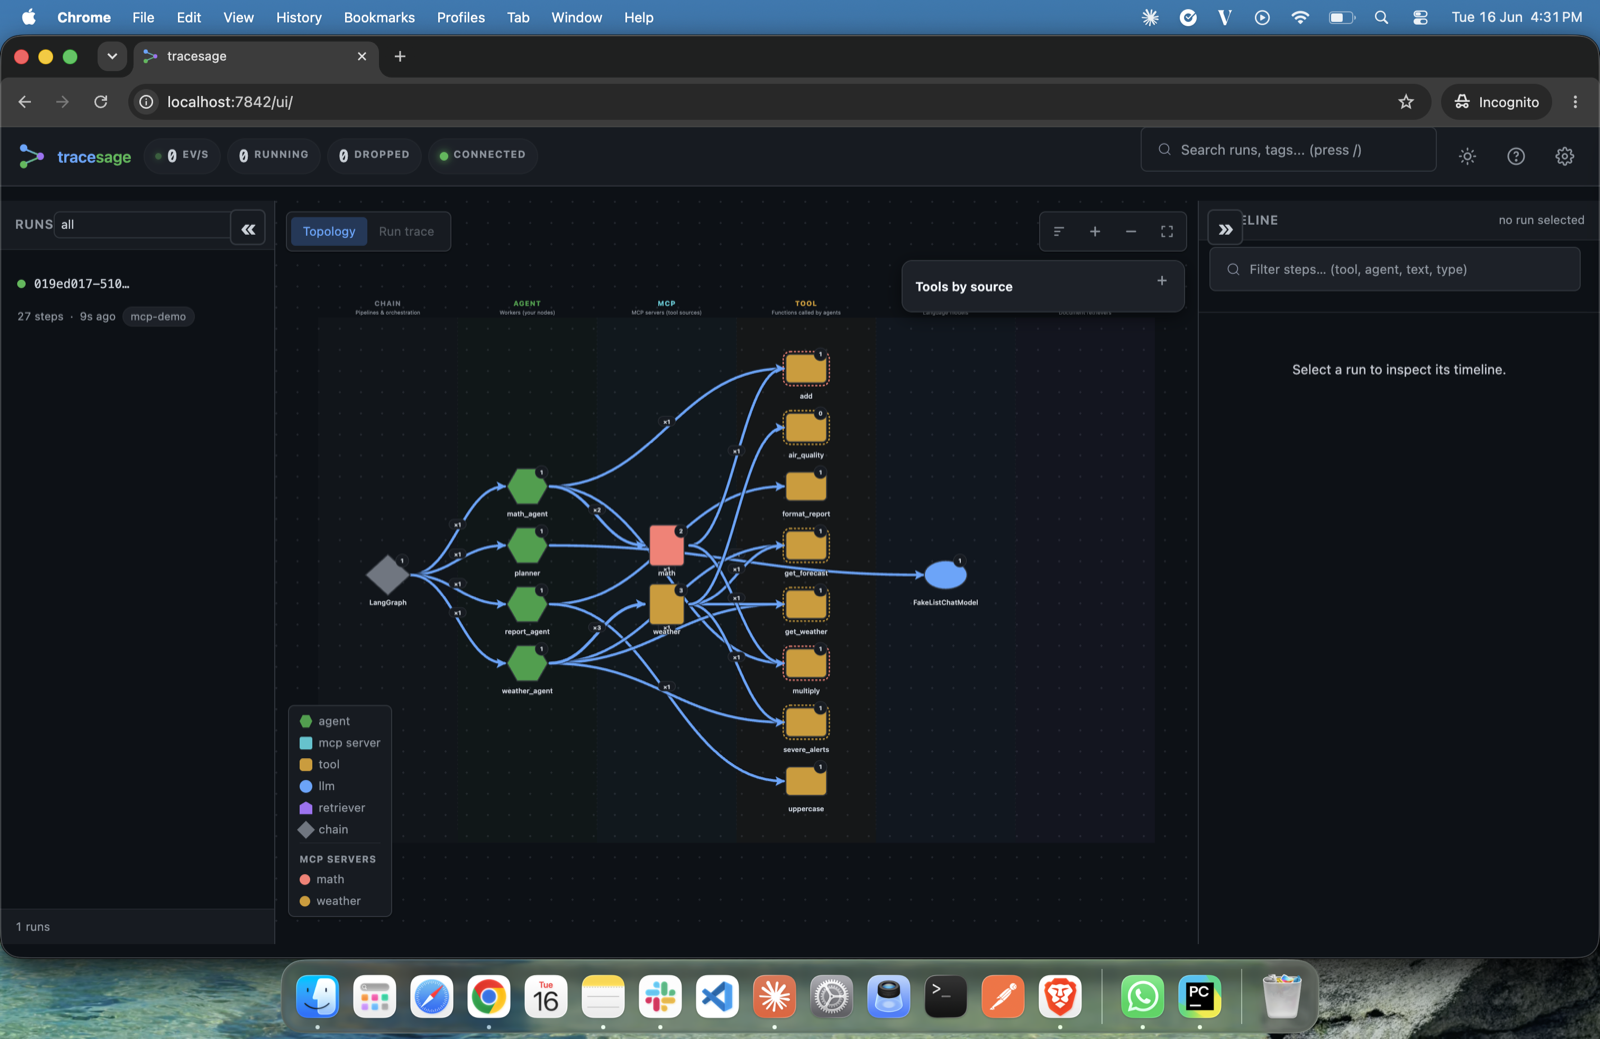
Every node in the graph is one of the kinds below; the legend (bottom-left) colour-codes them, and MCP servers are listed separately.
| Kind | What it is | Common examples |
|---|---|---|
agent |
A named function you defined as a LangGraph node, that calls other components | agent:billing_agent, agent:fact_extractor, agent:supervisor |
tool |
A side-effect function the agent invokes (DB query, API call, calculation) | tool:lookup_account, tool:run_sql, tool:cite_sources |
llm |
A language model call (chat or completion) | llm:FakeListChatModel, llm:ChatOpenAI, llm:ChatAnthropic |
retriever |
A BaseRetriever subclass invocation — the "R" in RAG |
retriever:FastFakeRetriever, retriever:Chroma, retriever:FAISS |
chain |
Plumbing — LCEL primitives, the LangGraph state machine, routing functions | chain:LangGraph, chain:RunnableSequence, chain:ChatPromptTemplate, chain:route_after_quality |
mcp |
An MCP server (synthesized, not an event) — groups the tools loaded from that server | mcp:weather, mcp:math, mcp:github |
In the UI, each kind renders with its own color/shape and click-to-detail behavior. Edges between nodes show "this kind invoked that kind, N times across all runs".
The topology is de-duplicated: a node that runs many times (or a loop, e.g. a
write→critic cycle) is one box with a back-edge, not one box per visit — each individual
invocation/iteration is a separate step in the timeline / replay. Parallel and
concurrent (asyncio.gather) branches are attributed correctly to their own run/parent
even though they share one tracer — LangChain's run_id/parent_run_id drives the
grouping, and the handler is safe under concurrency.
How tracesage decides which kind a node is
When events land in storage, tracesage classifies each event by walking a
priority list (defined in storage/sqlite_backend.py::get_topology):
event_typefirst.chat_model_start/llm_start/llm_end/llm_error→llm-
retriever_start/retriever_end/retriever_error→retriever -
tool_nameset (because the event came from aBaseTool) -
→
tool -
agent_namematches a known LangChain primitive RunnableSequence,RunnablePassthrough, etc.ChatPromptTemplate,StrOutputParser,LangGraph-
→
chain -
Any other
agent_name -
→
agent -
Demotion pass. After the first four steps, any node classified as
agentthat has no descendant events (no children calling it) is demoted tochain. This catches LangGraph routing functions (e.g.route_after_quality) — they get achain_start/chain_endpair with anagent_name, but never call anything, so they're plumbing, not cognition. -
MCP overlay (synthesized). If you've registered MCP attribution, tracesage also adds one
mcp:<server>node per server and wiresmcp → toolandagent → mcpedges. These don't come from callback events — they're a provenance overlay (see MCP server nodes).
You don't need to remember this rule — it's deterministic and you'll see the result in the UI directly. The point is: what's an agent vs. a chain is a property of what the function actually does at runtime, not what LangChain calls the callback.
The five kinds in detail
agent — your code
An agent node represents a function you registered as a LangGraph
node, that calls something else (an LLM, a tool, a sub-agent).
Conceptually: the place "your business logic" runs.
Example agent nodes (you'll build your own — see the examples gallery):
- A support-triage app:
agent:triage,agent:billing_agent,agent:tech_agent,agent:escalation_agent - A research pipeline:
agent:ingest,agent:retrieve,agent:fact_extractor,agent:sentiment,agent:entities,agent:synthesize - A data-analyst supervisor:
agent:supervisor,agent:sql_agent,agent:chart_agent,agent:narrative_agent
In the UI: typically the most prominent nodes — they sit in the middle of the topology and connect outward to the tools / LLMs / retrievers they use.
Why it matters: edges from agent: nodes tell you what each part of
your code calls. A common debugging move is "is agent:answer reaching
tool:cite_sources in every run, or only some?"
tool — side-effect functions
A tool node represents a function decorated with @tool (or otherwise
registered as a BaseTool). Tools do real work: DB queries, API calls,
file I/O, calculations. They don't call other things — they're terminal
in the topology.
In the integration guide:
- System 1:
tool:lookup_account,tool:issue_refund,tool:run_diagnostic,tool:check_logs - System 5:
tool:cite_sources - System 9:
tool:flaky_fetch(this is where the failure path lives —error_count = 1)
In the UI: usually leaves of the topology graph. Their full payload (via "show full payload") shows the input and output of each invocation.
Why distinguish from agents?
- Tools are where you'd add retries, caching, rate-limiting, authn
- Tools are where bugs outside the LLM live — wrong query, stale cache, bad API response
- "How many tool calls did this run make?" is a useful cost / latency signal, separate from "how many agent invocations".
llm — language models
An llm node represents a chat model or completion model invocation.
Every direct model.ainvoke(...), LLMChain, or LCEL chain ending in an
LLM lands here.
In the integration guide:
- All systems with the default
LLM_PROVIDER=fake:llm:FakeListChatModel - With
LLM_PROVIDER=openai:llm:ChatOpenAI - With
LLM_PROVIDER=anthropic:llm:ChatAnthropic - With multiple models: each appears as a separate
llm:<name>node
In the UI: the LLM step's full payload contains the prompts, the
generated text, and (if the model reports it) token_usage. For streaming
models, the _stream field shows TTFT, streamed token count, and
tokens/sec (reported when you stream tokens from the model).
Why distinguish from chain? An LLM call is the thing you want to
count, cost, and cache. The chain:RunnableSequence that wraps it is
plumbing — it doesn't generate tokens.
retriever — context fetchers
A retriever node represents a BaseRetriever subclass invocation. This
is the "R" in RAG: vector stores, BM25, hybrid search, custom retrievers.
Examples (see the RAG apps in the examples gallery):
- A research pipeline:
retriever:_FixedCorpusRetriever - A two-stage RAG app: a fast
retriever:followed by anllm:reranker — the reranker is an LLM invocation in this design, not a second retriever.
In production: retriever:Chroma, retriever:FAISS,
retriever:MultiQueryRetriever, retriever:ParentDocumentRetriever, etc.
In the UI: retrievers have their own callback events
(retriever_start / retriever_end) that capture the query and the
returned documents (with their metadata, and relevance scores when the retriever
provides them) in one structured payload. The node label is retriever:<class name>
of the BaseRetriever subclass whose callback fired (e.g. retriever:Chroma).
Why distinguish? Retrieval quality is its own debugging dimension. "Did we retrieve the right docs?" is a different question from "Did the LLM use them well?". When you have multiple retrievers (e.g. fast index + reranker), you want to see them as separate boxes in the topology so you can compare their behavior.
chain — plumbing
A chain node represents infrastructure, not business logic. It
covers four things:
- LCEL
RunnableSequence— the valueprompt | llm | parserproduces. tracesage decomposes the sequence into its components, so an LCEL chain shows up aschain:RunnableSequenceconnected tochain:ChatPromptTemplate,llm:<name>, andchain:StrOutputParser. - LCEL primitives —
ChatPromptTemplate,StrOutputParser,RunnablePassthrough,RunnableLambda, etc. - The LangGraph state machine itself —
chain:LangGraphappears in every run as the orchestrator that dispatches between your nodes. - Demoted "agents" with no children — typically routing functions in
add_conditional_edges, e.g.chain:route_after_critic,chain:route_after_supervisor.
Examples:
- Every LangGraph app:
chain:LangGraph(the orchestrator) - LCEL pipelines decompose — you'll see
chain:RunnableSequence,chain:ChatPromptTemplate,chain:StrOutputParsereach at multiple invocations - A writer-critic loop:
chain:route_after_critic— a routing function with no LLM/tool inside, demoted fromagenttochain
In the UI: usually upstream of agents — they're the "wrapping" machinery.
Why distinguish from agent? Counting chain:LangGraph and
chain:route_after_critic as agents would inflate the "how many of my
agents ran" metric to noise. Real agents do reasoning; chains are
plumbing. Keeping them separate makes per-agent metrics meaningful.
MCP server nodes (a synthesized node)
The five kinds above each map to a LangChain callback event. There is one more
node type you'll see in the topology — mcp — but it is synthesized, not
emitted by a callback.
When you attribute tools to their MCP server (via register_mcp_client, see
mcp.md), tracesage adds one mcp:<server> node per server and draws edges
mcp → tool (the tools that server provides) and agent → mcp (agents that called
them). The tool nodes themselves are still ordinary tool nodes — the mcp node is a
grouping/provenance overlay so you can answer "which tools came from which server, and
which are hardcoded?" A server's tools appear even if a given run never called them.
mcp nodes only exist when you've registered MCP attribution; a pure-LangChain trace
has just the five event-based kinds.
Putting it together: a research pipeline walked through
A representative research-pipeline topology — run any app in examples/showcase/
to see your own — decomposes like this:
[topology]
chain:LangGraph              ← the LangGraph orchestrator
├ agent:ingest               ← your `ingest()` LangGraph node
│   ├ tool:web_search        ← @tool function
│   ├ tool:fetch_document    ← @tool function
│   └ llm:FakeListChatModel  ← LLM call inside ingest()
├ agent:retrieve             ← your `retrieve()` LangGraph node
│   └ retriever:_FixedCorpusRetriever  ← BaseRetriever subclass
├ agent:fact_extractor       ← your `fact_extractor()` node
│   └ llm:FakeListChatModel  ← LLM call (same model class as above)
├ agent:sentiment            ← parallel branch
│   └ llm:FakeListChatModel
├ agent:entities             ← parallel branch
│   └ llm:FakeListChatModel
└ agent:synthesize
    ├ llm:FakeListChatModel
    └ tool:cite_sources
So when you saw 12 topology nodes after running 3 topics, they were:
- 6 ×
agent:(your LangGraph nodes) - 1 ×
chain:LangGraph(the orchestrator) - 1 ×
llm:FakeListChatModel(one node, multiple invocations) - 1 ×
retriever:_FixedCorpusRetriever - 3 ×
tool:(web_search, fetch_document, cite_sources)
The same logic applies to every app in the examples gallery.
Event types vs topology kinds
There's a separate-but-related concept worth knowing: event types. A topology kind tells you what a node is; an event type tells you what just happened. Each topology kind is fed by a specific subset of event types:
| Kind | Event types that produce it |
|---|---|
agent |
chain_start, chain_end, chain_error, agent_action, agent_finish (with a non-primitive agent_name and descendants) |
tool |
tool_start, tool_end, tool_error |
llm |
llm_start, llm_end, llm_error, chat_model_start |
retriever |
retriever_start, retriever_end, retriever_error |
chain |
Same as agent, but with primitive agent_name or no descendants |
mcp |
None — synthesized from MCP tool attribution, not a callback event |
The synthetic run_start event is tracesage-internal and doesn't produce
a topology node — it exists so the dashboard's run list gets a lifecycle
ping when a root run begins. (run_end is a reserved event type but is not
currently emitted; run completion is inferred from the root chain ending.)
Where to go next
- Run an example to see the kinds in your own UI:
python examples/showcase/11_supervisor_research_team/after.pythen openhttp://localhost:7842/ui - Browse the gallery to see different combinations of kinds: the examples gallery
- Check the topology source-of-truth in
src/tracesage/models.py(theTopologyNodeandEventTypedefinitions) andsrc/tracesage/storage/sqlite_backend.py::get_topology()(the classification SQL).